
Windows Guide
Connections, Live Connections and logs (Windows)
See what ProxyBridge is doing on Windows: the Connections log, the Activity Log, the Live Connections table with bytes sent and received, log filters, and the logging settings.
Connections, Live Connections and logs
The main window has three tabs. Each answers a different question:
| Tab | Question it answers |
|---|---|
| Connections | What has connected, and which way did it go? A running log with one line per new connection |
| Activity Log | What is ProxyBridge itself doing? Messages from the engine: start-up, rule changes, proxy problems |
| Live Connections | What is going through a proxy right now, and how much? A table of open connections with bytes sent and received |
Connections
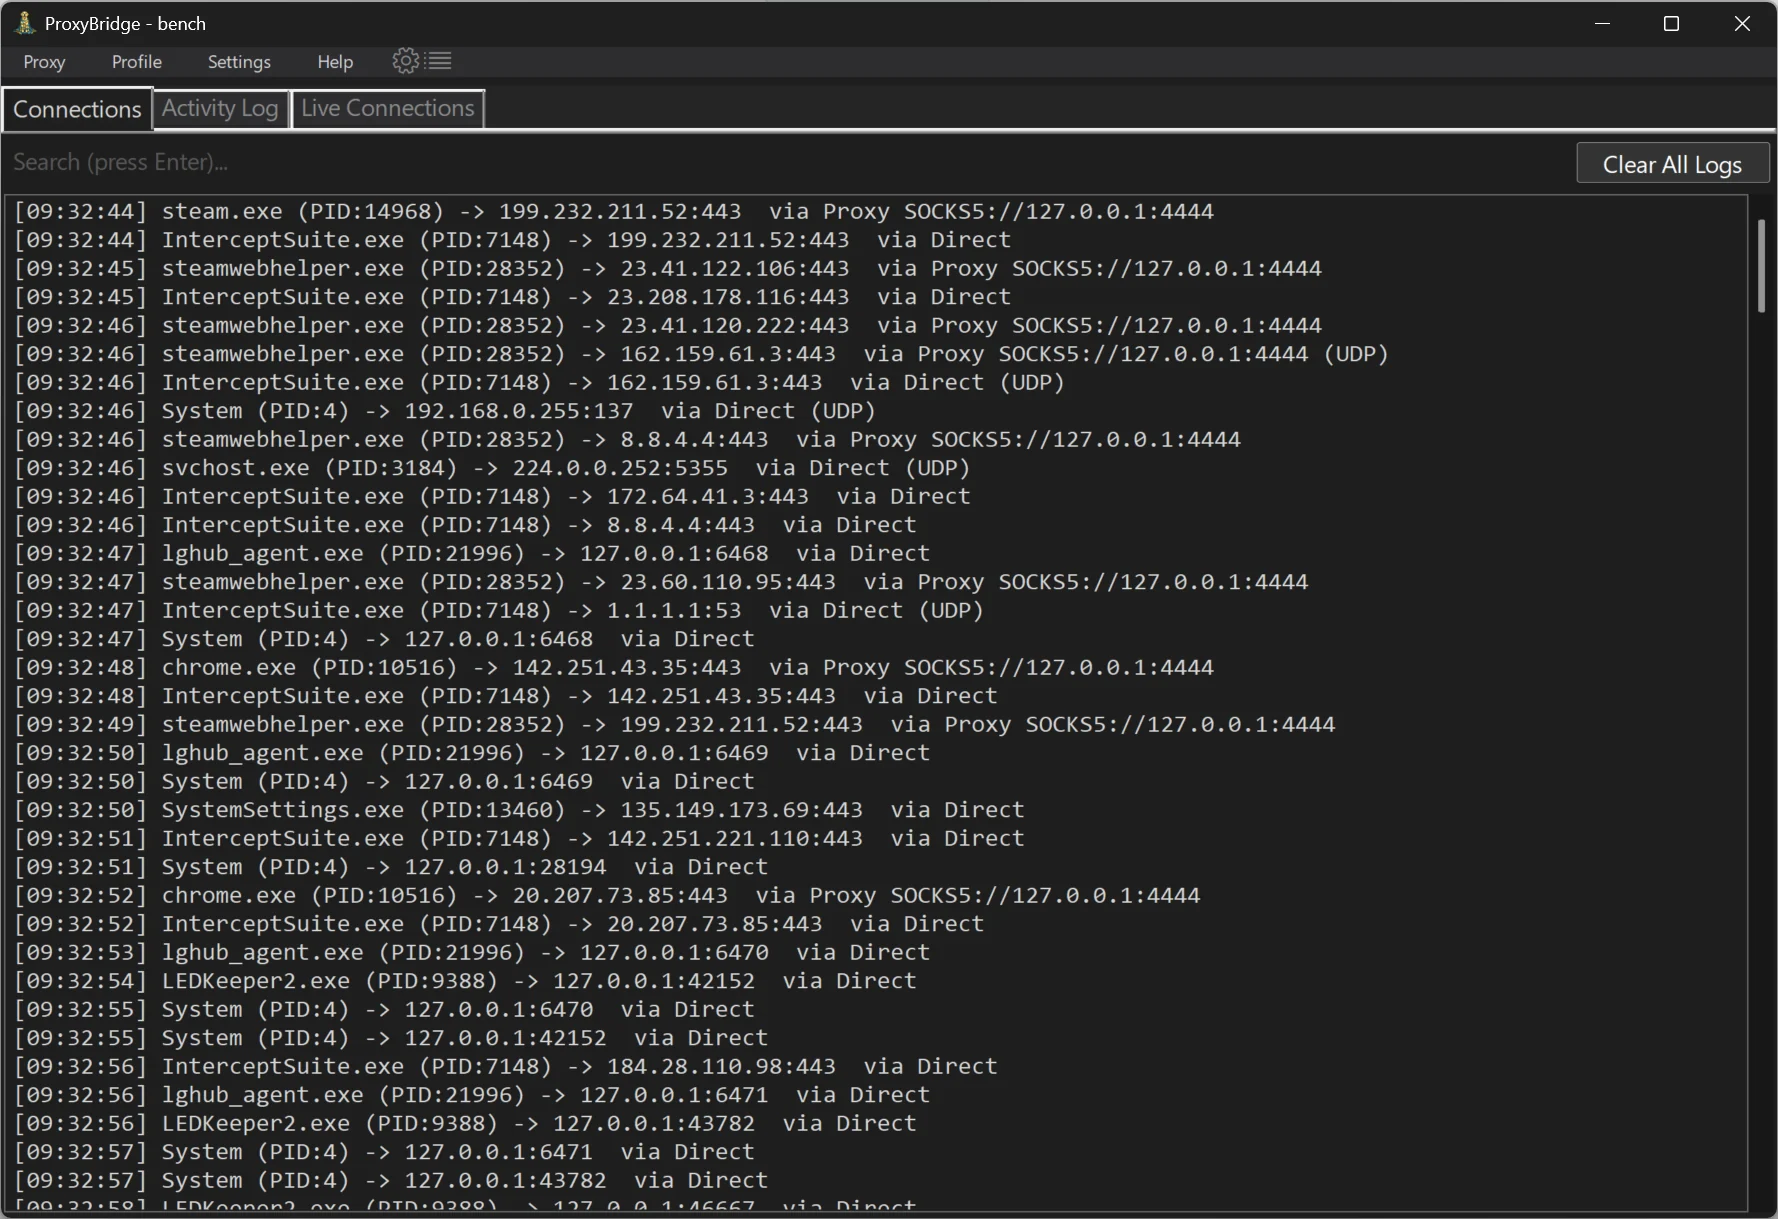
Each new connection adds a line:
[09:32:44] steam.exe (PID:14968) -> 199.232.211.52:443  via Proxy SOCKS5://127.0.0.1:4444
[09:32:46] steamwebhelper.exe (PID:28352) -> 162.159.61.3:443  via Proxy SOCKS5://127.0.0.1:4444 (UDP)
[09:32:47] lghub_agent.exe (PID:21996) -> 127.0.0.1:6468  via Direct
A line shows the time, the program and its PID, the destination address and port, and the route:
| Route | Meaning |
|---|---|
via Proxy SOCKS5://host:port or via Proxy HTTP://host:port |
A rule sent it through that proxy |
via Direct |
No rule matched, or the matching rule says Direct |
via Blocked |
A Block rule dropped it |
(UDP) at the end |
A UDP flow instead of a TCP connection |
Use this tab to confirm your rules do what you intended: start the application, then look for the lines of that program.
One line per destination, or every connection
To keep the log short, ProxyBridge lists a connection once for each identical combination of program, destination address, destination port and route. An application that opens 50 connections to the same server shows one line.
To see every connection, tick Settings > Log Every Connection (available from version 4.3.0). Then every new TCP connection gets a line, and so does every new UDP flow (a UDP flow is one local port talking to one destination; it is logged again only after 30 seconds of silence, so a busy UDP sender cannot flood the log). The setting is saved with the profile.
It only changes what is listed. Rules are applied to the same connections either way.
Search
Type in the box above the log and press Enter. Only lines containing your text are shown (for example a program name, an IP address or Proxy). Clear the box and press Enter to show everything again.
Clear
The Clear All Logs button above each log empties that tab's log.
Log Filters
If one noisy program buries the lines you care about, hide it. Choose Proxy > Log Filters...
A filter has six fields. Each of them, except Mode, can be left empty (or set to All) to ignore it:
| Field | Meaning |
|---|---|
| Mode | Include: show only connections that match. Exclude: hide connections that match |
| Process | A program name. Wildcards work: chrome*, *.exe, *ch* |
| IP | A destination address, with wildcards: 192.168.* |
| Port | A destination port |
| Protocol | TCP, UDP or All |
| Action | Proxy, Direct, Block or All |
How the filters combine:
- Exclude filters run first. If a connection matches any of them, it is hidden.
- If you have any Include filters, a connection is shown only if it matches at least one of them.
- With no filters at all, everything is shown.
A filter matches a connection when all its non-empty fields match.
Examples:
| Goal | Filter |
|---|---|
| Hide Windows background noise | Exclude, Process svchost.exe |
| Hide everything on the local machine | Exclude, IP 127.* |
| Watch one program only | Include, Process chrome.exe |
| Watch only what is being proxied | Include, Action Proxy |
Filters change only the Connections log. They do not change how traffic is routed, and they do not affect Live Connections. Filters are saved with the profile.
Enable Traffic Logging
Settings > Enable Traffic Logging switches the Connections log on and off. When it is off, no new lines appear. Routing is not affected, and Live Connections keeps working.
Auto Clear Logs
Settings > Auto Clear Logs keeps memory use low: when a log grows past 500 lines it is cleared. With it off, each log keeps the most recent 4000 lines and drops the oldest.
Activity Log
The Activity Log tab shows what the ProxyBridge engine reports about itself, with the time of each message. You will see lines about:
- the engine starting
- rules and proxies being added
- problems reaching a proxy server, for example when the proxy is not running
Check it first when a proxied application cannot connect. A message that the proxy could not be reached tells you the proxy, not the rule, is the problem.
Live Connections
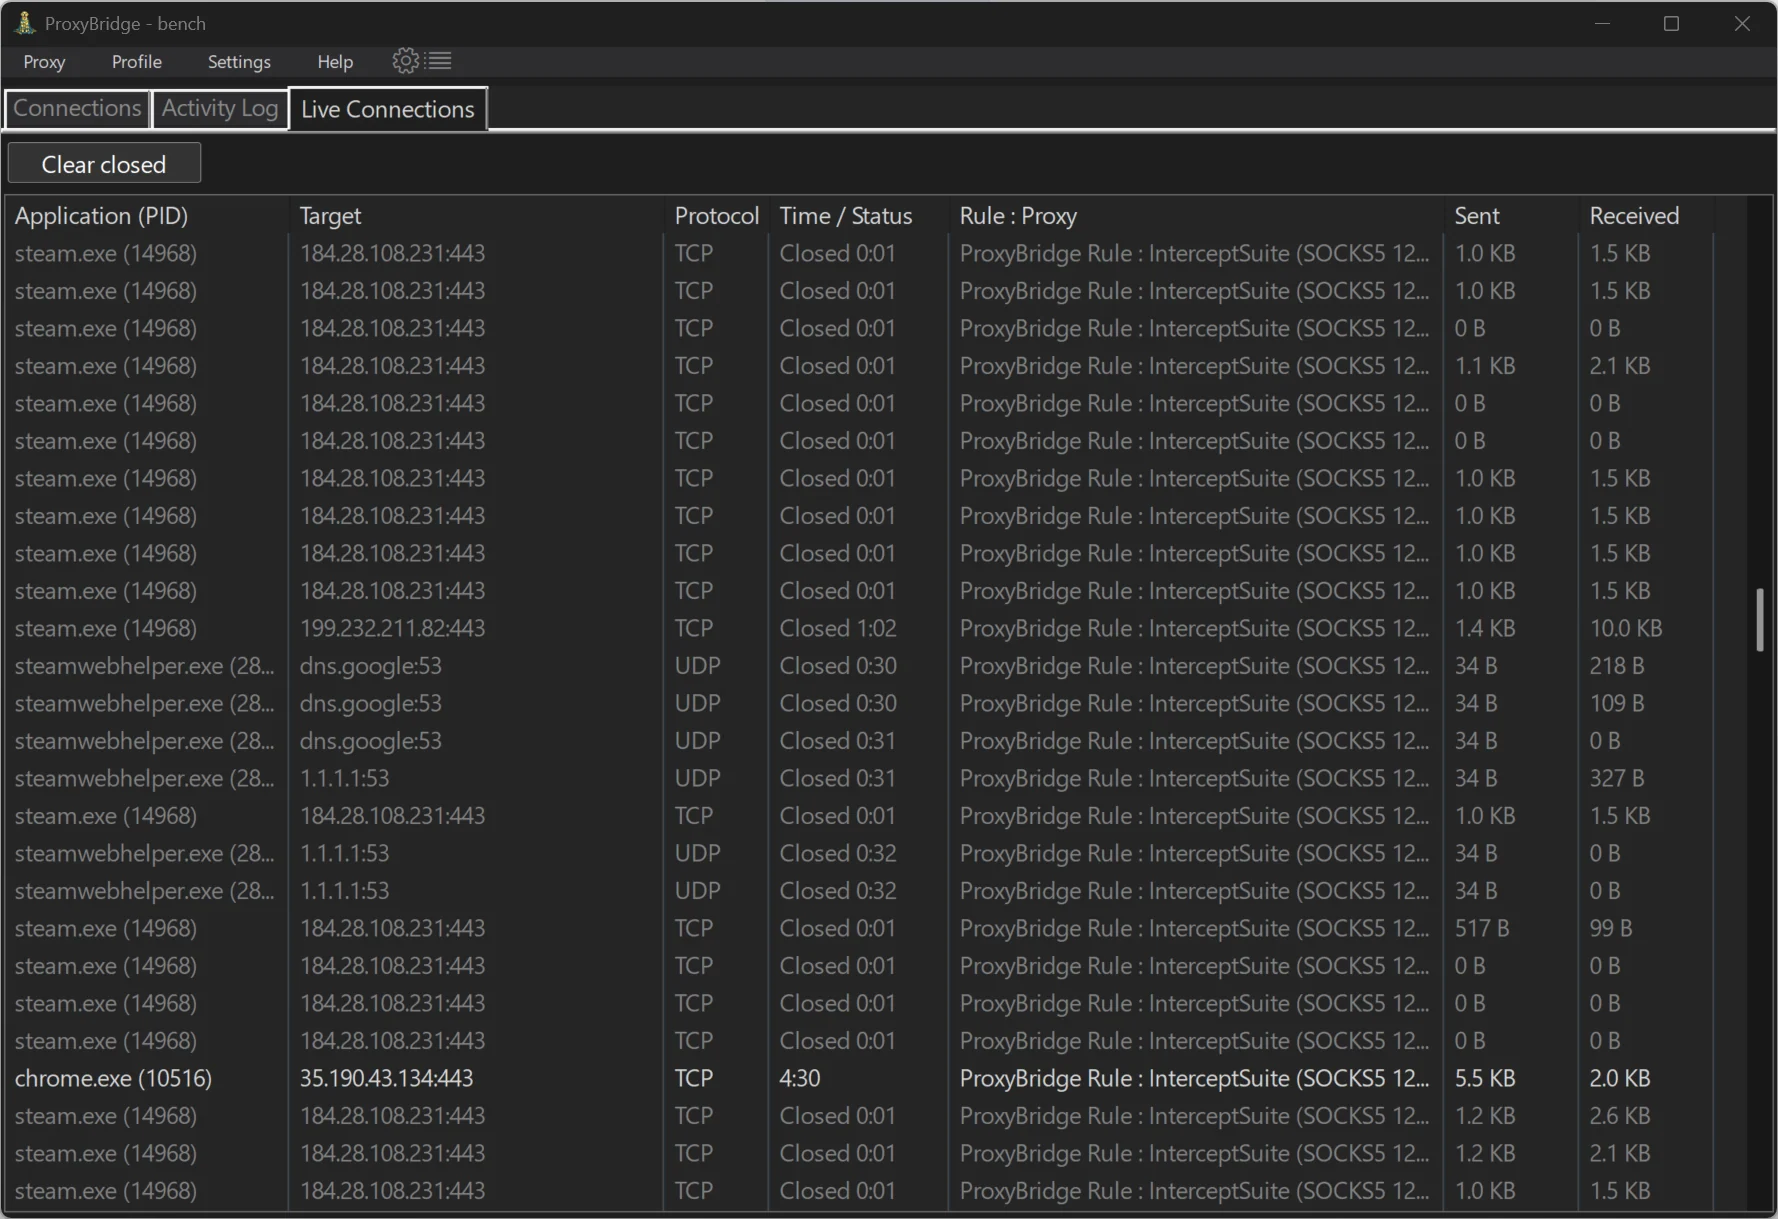
Live Connections is a table of the connections ProxyBridge is relaying through a proxy. Unlike the Connections log, which only says a connection started, this table shows whether it is still open, which rule and proxy carried it, and how much data it has moved.
| Column | Meaning |
|---|---|
| Application (PID) | The program and its process ID |
| Target | The destination, as host:port. The host name is shown when ProxyBridge knows it (see domain names), otherwise the IP address |
| Protocol | TCP or UDP |
| Time / Status | How long the connection has been open, as minutes and seconds (4:30) or hours (1:02:10). A finished connection reads Closed and its total time |
| Rule : Proxy | The name of the rule that matched and the proxy it used, with the proxy's type and address, for example Browser to Burp : Burp (HTTP 127.0.0.1:8080) |
| Sent | Data the application sent through the proxy |
| Received | Data that came back from the proxy |
Click a column heading to sort by it, and click again to reverse. New connections appear at the top by default.
How rows behave
- A row appears when the connection is established through the proxy and its counters update about once a second.
- When the connection ends, the row turns grey and shows
Closedwith its total time and final byte counts. It stays in the list so you can read it. - Press Clear closed to remove the finished rows. Connections that are still open are kept.
- The list holds up to 1200 rows. If it fills up, the oldest finished row is replaced by a new one.
- A UDP flow has no real "close". It counts as finished after 30 seconds without traffic. If it starts again it becomes a live row again.
- When you leave the tab and come back, finished rows are still there, and connections that are still open turn live again.
What the numbers mean
Sent and Received are the data bytes ProxyBridge forwarded between the application and the proxy. They do not include network headers or the proxy handshake, so they are a little lower than what a network monitor reports for the same connection.
What is not listed
- Direct and Blocked traffic. Only connections that go through a proxy are relayed by ProxyBridge, so only those can be counted and timed. They still appear in the Connections log.
- Connections still being set up, until the proxy accepts them.
Using it
- Verify routing: open the tab, start your application, and check that its rows show the rule and proxy you expect. A program that does not appear is not matching a Proxy rule.
- Find what is moving data: sort by Sent or Received to see which program or connection is transferring the most.
- Spot a stuck connection: a long-lived row that stays at
0 Bis waiting on something. - Prove UDP is going through the proxy: UDP flows show as rows with the protocol
UDP.
The tab asks the engine for an update once a second, and only while it is open. It uses almost nothing, and leaving the tab stops it.
Version note. Live Connections is available from version 4.3.0. It needs the app and the service to be the same version; if they differ, the app asks you to run the installer again.