
Linux Guide
Connections, Live Connections and logs (Linux)
See what ProxyBridge is doing on Linux: the Connections log, the Activity Logs, the Live Connections table with bytes sent and received, log filters, and the logging settings.
Connections, Live Connections and logs
The main window has three tabs: Connections, Activity Logs and Live Connections. Together they answer what is my application connecting to, which rule decided, and is it going through the proxy right now?
At the bottom of the window, a status bar shows the state at a glance:
Engine: Running | Profile: Pentest lab | Proxies: 4 | Rules: 5 | 0 conn/s
| Part | Meaning |
|---|---|
| Engine | Running when ProxyBridge is applying your rules, Stopped after Proxy > Stop Engine, Starting... and Stopping... in between |
| Profile | The active profile |
| Proxies, Rules | How many are loaded |
| conn/s | How many connections were logged in the last second |
Connections
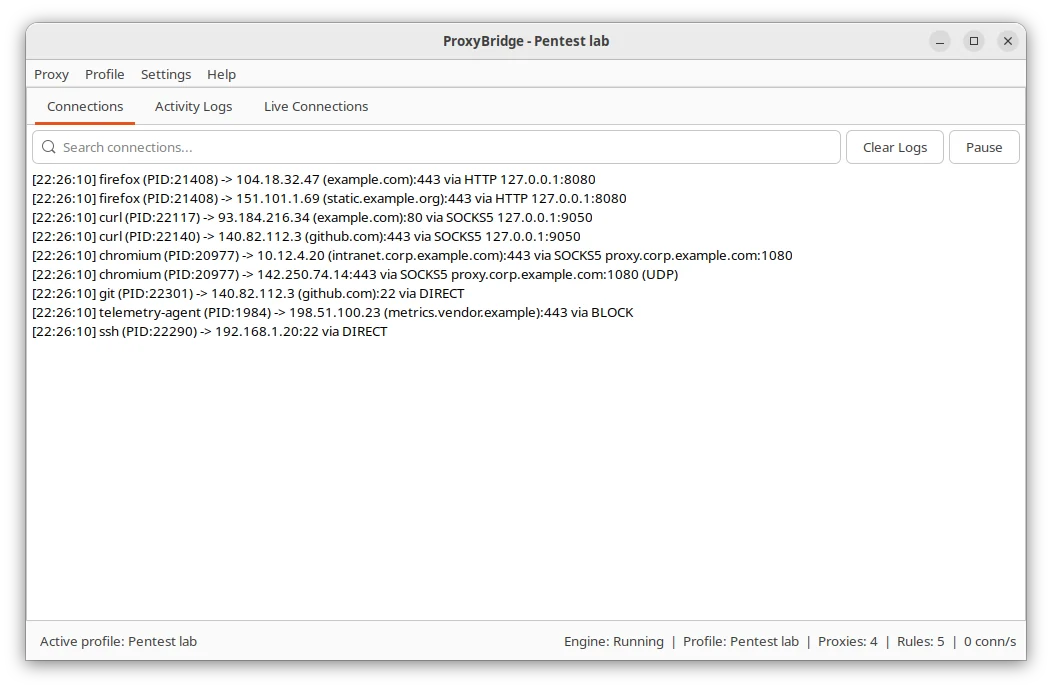
Every connection ProxyBridge decides about is listed as one line:
[22:23:49] firefox (PID:21408) -> 104.18.32.47 (example.com):443 via HTTP 127.0.0.1:8080
[22:23:49] curl (PID:22117) -> 93.184.216.34 (example.com):80 via SOCKS5 127.0.0.1:9050
[22:23:49] chromium (PID:20977) -> 142.250.74.14:443 via SOCKS5 proxy.corp.example.com:1080 (UDP)
[22:23:49] git (PID:22301) -> 140.82.112.3 (github.com):22 via DIRECT
[22:23:49] telemetry-agent (PID:1984) -> 198.51.100.23 (metrics.vendor.example):443 via BLOCK
| Part | Meaning |
|---|---|
[22:23:49] |
The time |
firefox (PID:21408) |
The program and its process ID |
-> 104.18.32.47 (example.com):443 |
The destination address and port. The name in brackets is shown when the program looked it up with ordinary DNS |
via HTTP 127.0.0.1:8080, via SOCKS5 ... |
Sent through that proxy |
via DIRECT |
Not touched: no rule matched, or the rule says Direct |
via BLOCK |
Refused by a Block rule |
(UDP) at the end |
A UDP flow. A line without it is TCP |
A via Direct line for something you expected to be proxied means no rule matched it. See Troubleshooting.
UDP lines you did not expect. Before a program connects to a server, the system's name lookup often opens a UDP socket towards each address of the server just to choose the best source address. Those sockets send nothing, but ProxyBridge sees the
connectcall, so you may see(UDP)lines to port 80 or 443 for a server you only use over TCP. They are harmless.
One line per destination, or every connection
By default a connection is listed once per program, destination, port, protocol and action. A program that opens fifty connections to one server gets one line, so the log stays readable.
Tick Settings > Log Every Connection to list every new TCP connection and every new UDP flow instead. A UDP flow is listed again after 30 seconds of silence. The setting is saved in the profile.
Each decision is listed exactly once, whether the kernel or the relay made it.
Search
Type in the search box above the log. A line is shown when it contains the text, in any case. Clearing the box shows everything again. The search only changes what you see; nothing is deleted.
Pause
Pause (a toggle) holds new lines back so you can read the screen. They appear when you release the button.
Clear
Clear Logs empties the list.
Log Filters
Proxy > Log Filters... decides which lines the Connections log shows at all. Use it to hide noise, for example your resolver, or to watch one program.
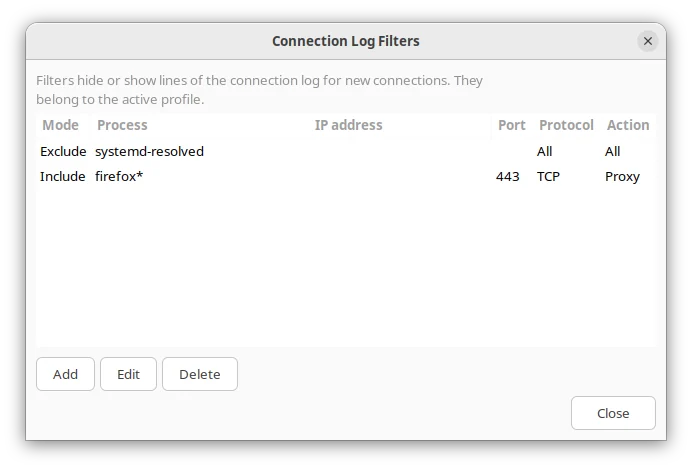
Click Add (or Edit, or double-click a row) to open a filter:
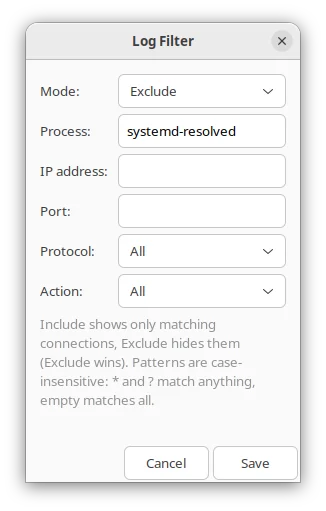
| Field | What it matches |
|---|---|
| Mode | Include (show matching lines) or Exclude (hide matching lines) |
| Process | The program name. Empty or * matches any |
| IP address | The destination address (the text of the address, with or without the name). Empty matches any |
| Port | The destination port. Digits, * and ? only. Empty matches any |
| Protocol | All, TCP or UDP |
| Action | All, Direct, Proxy or Blocked |
Patterns are case-insensitive and may use * (any text) and ? (one character). A filter matches a line when all its fields match.
How filters combine:
- Exclude filters run first: any match hides the line.
- If there are Include filters, a line must match at least one of them.
- With no filters, every line is shown.
Filters are saved in the profile (up to 64) and apply to new connections as they happen. They only change what the log shows: your traffic is not affected.
Examples:
| Goal | Filter |
|---|---|
| Hide the system resolver | Exclude, Process systemd-resolved |
| Watch only Firefox's proxied HTTPS | Include, Process firefox*, Port 443, Protocol TCP, Action Proxy |
| Hide all direct traffic | Exclude, Action Direct |
| See only what gets blocked | Include, Action Blocked |
| Watch one server | Include, IP address 192.168.1.* |
Enable Traffic Logging
Settings > Enable Traffic Logging switches connection lines on or off at the source. Off, the Connections tab stays empty and ProxyBridge does a little less work; your rules still apply exactly as before. It is saved in the profile.
Auto-clear Logs
Settings > Auto-clear Logs (on by default) wipes a log once it grows past 500 lines, so a long session does not use more and more memory. Switch it off to keep a longer history instead (the last 2000 lines of Connections and 1000 of Activity Logs). It is saved in the profile.
Activity Logs
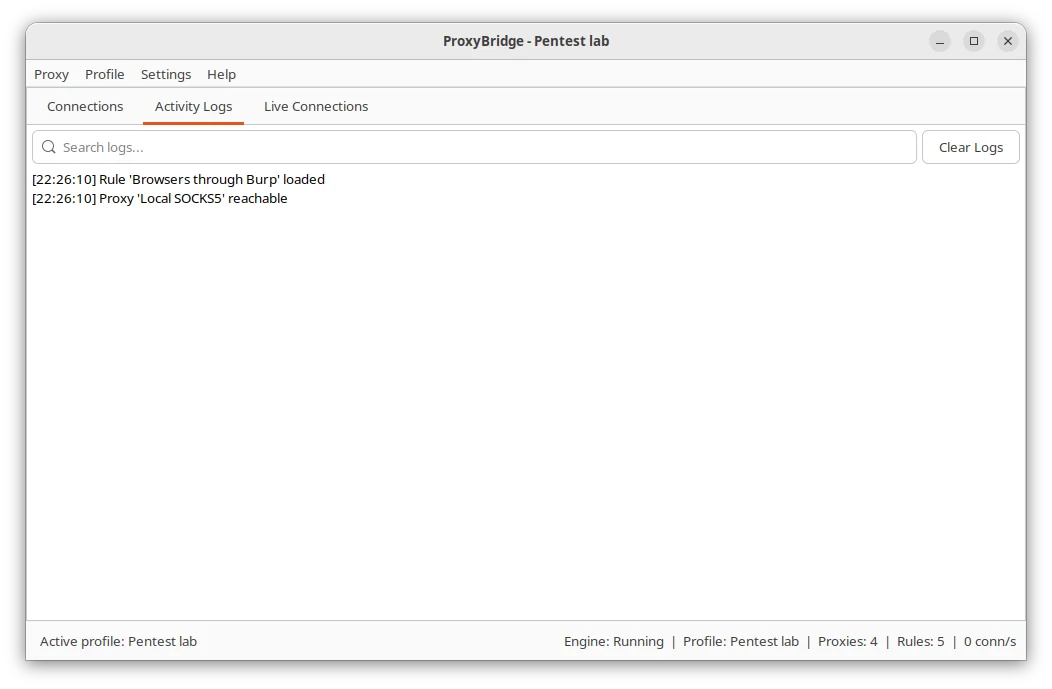
The Activity Logs tab shows what ProxyBridge itself is doing, not your applications: the engine starting and stopping, rules and proxies that could not be loaded, and problems on the way to a proxy. When the window opens it also shows what the ProxyBridge service did before (for example loading your profile at boot), then connected to the ProxyBridge service. It has the same search box and Clear Logs button as Connections.
Typical lines:
| Line | Meaning |
|---|---|
ProxyBridge started (eBPF datapath, relay tcp:24010 udp:24011) |
The engine is running. The numbers are the ports of the local relay |
Rule #2 (...) not loaded: ... |
The engine rejected a rule (the reason follows). Fix the rule |
Proxy '...' rejected: ... |
The engine rejected a proxy |
rule N sends UDP to HTTP proxy '...', which cannot carry UDP: that UDP traffic goes DIRECT |
A UDP rule points at an HTTP proxy. See UDP, QUIC and HTTP/3 |
relay: proxy SOCKS5 127.0.0.1:1080: connect to 127.0.0.1:1080 failed: Connection refused |
The proxy is not running or the address is wrong |
relay: proxy ... authentication failed (wrong username or password) |
The login is wrong |
relay: UDP associate failed: ... |
The SOCKS5 proxy refused to carry UDP |
relay: UDP datagram dropped (...) |
A UDP datagram was dropped, with the reason. Repeated drops are summarised, not repeated |
The full list of messages is in Troubleshooting.
Live Connections
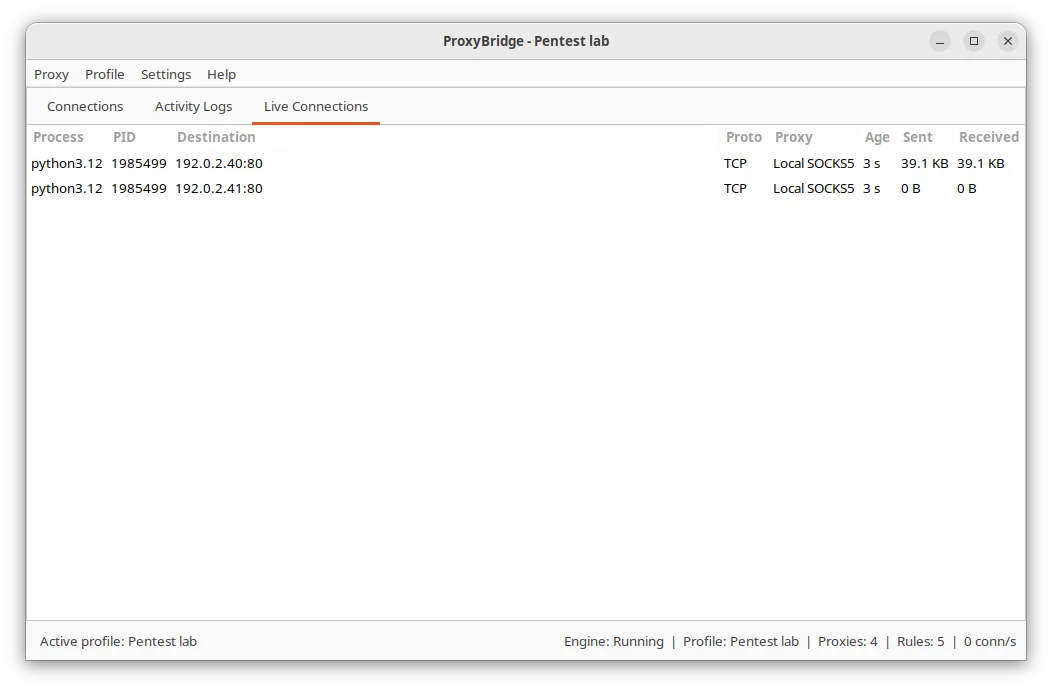
Live Connections shows what is going through a proxy right now, as opposed to the Connections log, which is a history. It refreshes once a second.
| Column | Meaning |
|---|---|
| Process, PID | The program and its process ID |
| Destination | The destination address and port. The name the program looked up is shown when it is known |
| Proto | TCP or UDP |
| Proxy | The proxy carrying the connection, by name |
| Age | How long the connection or flow has been open |
| Sent, Received | Payload bytes from the program to the proxy and back (for example 39.1 KB) |
How rows behave
- Newest first.
- A TCP connection is listed from the moment it is open until it closes.
- A UDP flow (one local port talking to one destination) is listed until it has been quiet for a while.
- Rows come and go on their own; there is nothing to clear.
What is not listed
Only connections that go through a proxy appear here. Direct and blocked traffic never passes through ProxyBridge's relay, so it has no byte counters and is not listed. Use the Connections log for those.
Using it
- Check that a long-running transfer really is on the proxy you expect.
- Watch bytes grow while an application downloads or uploads.
- Find a connection that stays open and never moves, a sign of a stuck proxy.
- Confirm that a UDP application (a game, QUIC) is sending to the proxy and receiving from it. If Received stays at 0 B while Sent grows, the proxy is not answering.